Graphing Inequalities
What does it mean?
Definitions:
When graphing linear inequalities, we use a lot of the same concepts that we used when we were solving linear equations. The difference: the solution to the linear equation is only one number, but when a variable is less than or greater than a number, there are an infinite number of values that would be a part of the answer.
Inequality Signs and Interval Notation:
Inequality
x > a x is greater than a
x < a x is less than a
x > 2
x < 2
Interval Notation for Open Intervals
(a, ∞)
(-∞, a)

(-∞, 2)
Inequality
x ≥ a x is greater than or equal to a
x ≤ a x is less than or equal to a
x ≥ 2
x ≤ 2
Interval Notation for Closed Intervals
[a, ∞)
(-∞, a]

(-∞, 2]
Multiplication/Division Properties for Inequalities:
Multiplying or dividing the same NEGATIVE number to both sides of an inequality reverses the sign of the inequality.
- If a < b and c is negative, then ac > bc
- If a < b and c is negative, then a/c > b/c
What does it look like?
$$-2 < 5 \space multiplied \space by \space (-3)$$ $$(-3)(-2) > 5(-3)$$ $$6 > (-15)$$ $$$$ $$-2 < 5 \space divided \space by \space (-3)$$ $$\frac{-2}{-3} > \frac{5}{-3}$$ $$\frac{2}{3} > \frac{-5}{3}$$ Graphing Linear Inequalities: y > mx + b & y ≥ mx + b
- Graph the solution to y < 2x + 3
The first step is to find the "equals" part. For two-variable linear inequalities, the "equals" part is the line $$y = 2x + 3$$
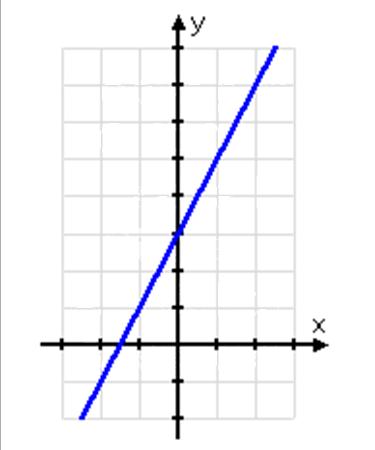
Now we are ready to do the "y less than" part. In other words, this is where we need to shade one side of the line or the other. We need y LESS THAN the line, so we want all the points below the line.
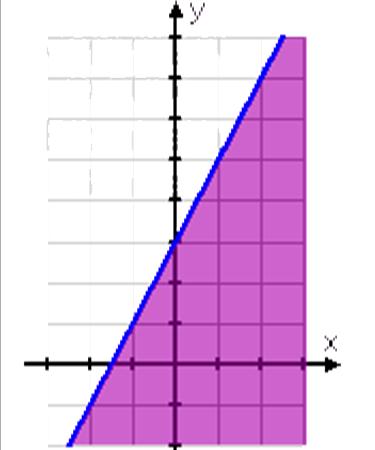
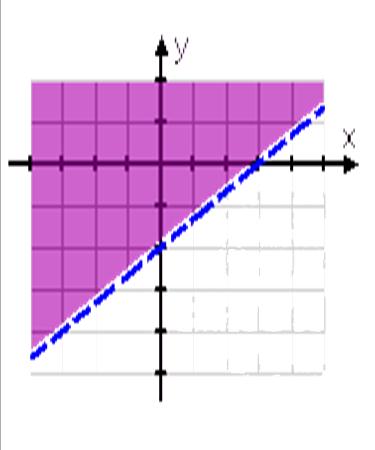
- Graph the solution to 2x – 3y ≤ 6
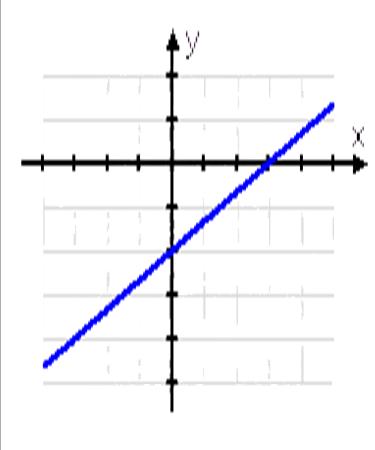
First, solve for y: $$2x – 3y ≤ 6$$ $$–3y ≤ –2x + 6$$ $$y ≥ \frac{2}{3}x – 2$$ Now, find the "equals" part, which is the line $$y = \frac{2}{3}x – 2$$
We have inequality where "y is greater than". The notation for a strict inequality is a dashed line. So the border of our solution region actually looks like this:
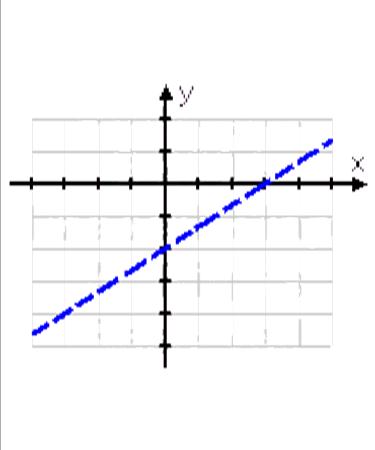
By using a dashed line, we know where the border is but we also know that the border isn't included in the solution. Since this is a "y greater than" inequality, we want to shade above the line.
You'll use it...
Temperature conversion, exchange rates for currency, plans for cell phones, travel, in cooking recipes, marketing and much more.
Video
Graphing Lines 1
Watch a Khan Academy Video »
Length: 9:50
Video
Interpreting Linear Graphs
Watch a Khan Academy Video »
Length: 5:05
Video
Graphing Inequalities
Watch a Khan Academy Video »
Length: 8:04
Video
Graphing Linear Inequalities in Two Variables
Watch a Khan Academy Video »
Length: 2:42